How Is Robotics Doing? Domenico Appendino’s Report
Robotics, whose sales are decreasing, still sets a new record, but only in the world population of industrial robots. Contrasting signals, therefore, from the data released by the IFR regarding the trend of the global robot market for 2019. And what are the forecasts for 2020? Who is so reckless as to gaze into the crystal ball? The SIRI – UCIMU Statistics Working Group has tried to draw up an objective picture of the first six months in Italy. Against this background, we asked Domenico Appendino, SIRI Chairman, to provide us with a picture of the situation and to discuss on the spur of the moment the figures for 2019 and those recorded in the first six months of this year.
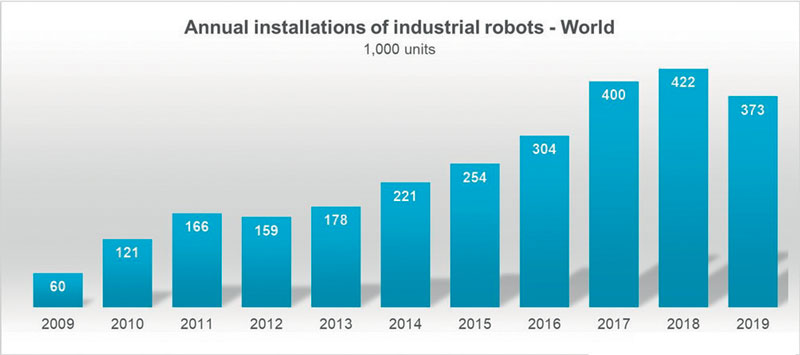
In 2019, the global economic recession and commercial tensions also left their mark on industrial robotics. During the year, 373,240 units of industrial robots were shipped worldwide, 12% less than in 2018 (IFR – Word Robotics 2020). This is a market worth 13.8 billion dollars for robots alone, but about three times as much (41 billion dollars) when software and peripherals, which are on average estimated at twice the value of robots, are also evaluated (Figure 1).
After six years of continuous growth, leading each year to absolute sales figures which were always positive and marked a new market record every year, 2019, on the other hand, saw a decline. President Appendino, excluding for the moment the pandemic issue which last year did not yet exist, how do you explain this downsizing?
Going back in time, in 2008 the average annual number of robots sold was around 115,000 units, a figure that dropped even further the following year when the global economic and financial crisis brought robot installations down to just 60,000 units due to the many investments which were postponed or even cancelled all over the world. In 2010 there was a resumption of investment that brought robot installations up to around 120,000 units, a figure which increased even further and doubled in 2015 reaching almost 254,000 units. In 2016 the threshold of 300,000 installations was exceeded and in 2017 installations rose to almost 400,000 units, a figure exceeded in 2018 for the first time before falling again in 2019. And this in spite of last year’s brighter forecast when IFR predicted a very slight decrease in installations in 2019 soon to be followed by a reversal of the trend that would push the number of installations consistently to reach an average annual growth of 12% from 2020 to 2022, certainly less than the 19% that had been its value from 2013 to 2018, but still positive. Annual growth, however, fell to 11% from 2014 to 2019. Evidently the real decrease was greater than expected.
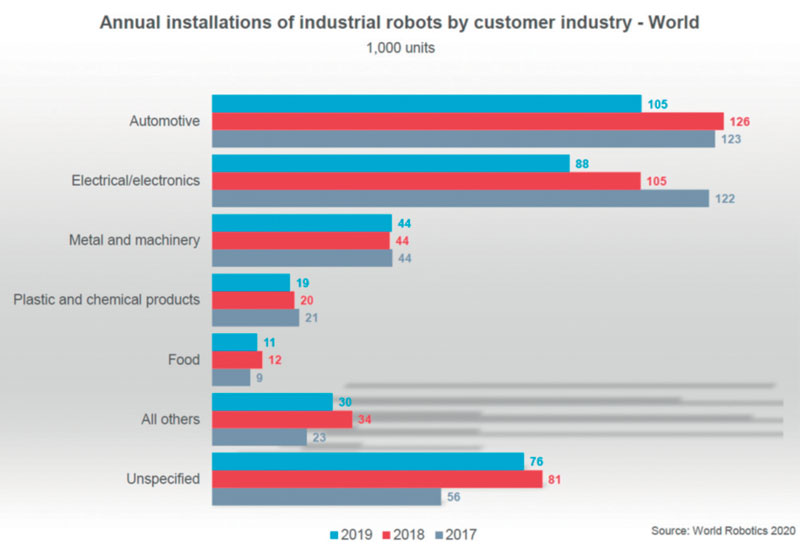
Unfortunately, the 2019 result unquestionably reflects the difficulties experienced and still faced by the two industrial sectors representing the main markets of robotics, the automotive sector and the electrical and electronics industry, united and strengthened by the reactions on the markets resulting from the trade conflict between China and the United States, two of the main destinations for robot sales, which is continuing to spread uncertainty throughout the global economy.
It is important to remember that in the world the automotive sector remains the largest industrial segment making use of robotics (Figure 2) with 28% of total installations, ahead of the electrical and electronics (24%), metal and machinery (12%), plastics and chemicals (5%) and food and beverage (3%) industries.
2019 may however be interpreted in two ways, because there are some positive indications which, apart from the pandemic, raise hopes; is that right?
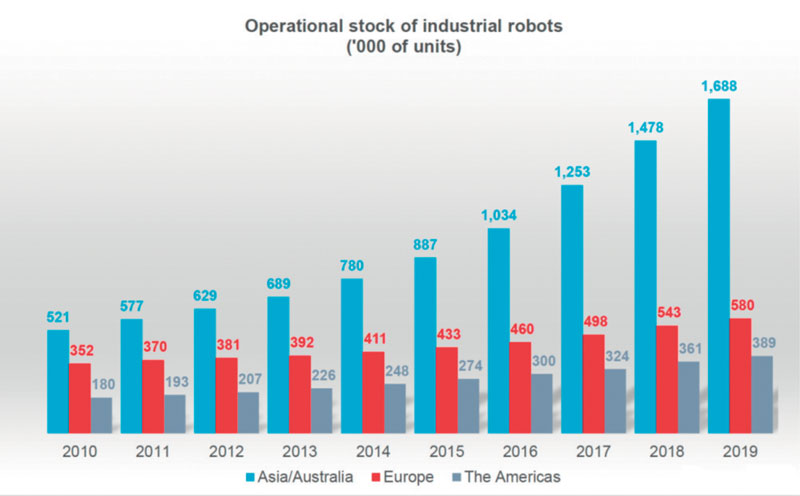
That is correct. Despite the drop in sales in 2019, the fleet of industrial robots working in the world has increased by 12% to 2,722,077 units, an all-time record with an average growth rate of 13% since 2014. Figures 3 and 4 show in units and percentage change respectively the development of the world’s industrial robot population from 2014 to 2019 in the three main continents. After Japan, the key players in Asia’s growth were Korea and, above all, China. Since 2014, the population of industrial robots in China has grown impressively, with an annual average of 33%, reaching 783,358 units in 2019, the equivalent of 29% of the global population, and surpassed Japan in 2016 as the country with the highest population of industrial robots in the world. The robot population in Japan increased by 12% to 354,878 units in 2019, representing 13% of the global population. Japan has been declining for about a decade but returned to growth in 2016 with average annual growth of 4% until 2019. Korea showed an average growth of 13% in the 2014-2019 period, reaching a population of 319,022 units representing 12% of the global population, thus coming very close to that of Japan. The total population of industrial robots in Asia therefore reached 1,687,800 units in 2019, 62% of the world population.

The European robot population, on the other hand, reached 579,948 units in 2019, 7% more than the previous year and represents 21% of the global population. Since 2014, the robot population in Europe has increased by an average of 7% each year, with a particularly high average annual growth rate in Central and Eastern Europe (+18%), while in Western Europe and the Nordic countries it has grown by an average of only 5% each year.
The Americas contribute 14% of the world’s industrial robot population, reaching 389,233 units (+8%) in 2019 after an average annual growth rate of 9% since 2014. Most of these industrial robots (362,136 units) are installed in North America (USA, Canada, Mexico).

Has the drop in sales in any case affected all the main markets?
As mentioned above, Asia is the world’s largest market for industrial robots, but after six years of peak values in this continent in 2019, installations fell substantially (-13%) to 245,158 units after peaking at 283,080 units in 2018. However, from 2014 to 2019, annual installations of robots in Asia increased by an average of 13% each year, so it is impressive to think that in 2019, as in 2018, out of every three robots sold worldwide, two were installed in Asia. Although with different values, the drop was present in all three major Asian markets: installations fell in China (140,492 units, -9%), Japan (49,908 units, -10%) and more consistently in Korea (27,873 units, -26%).
Robot installations in the second largest market, Europe, decreased less rapidly reaching 5% with 71,932 units compared to a peak of 75,560 units in 2018, marking, as in Asia, the end of a six-year period of growth at a rate of 10%.
In the Americas, installations fell by 13% to 47,809 units in 2019, a decrease equal to that of Asia. On this continent, too, a series of six years of new consecutive peaks came to an end, with the installation of 55,212 robots in 2018 and an average annual growth rate of 8% from 2014 (Figures 5 and 6).
However, there is a countertrend, namely the number of collaborative robots…
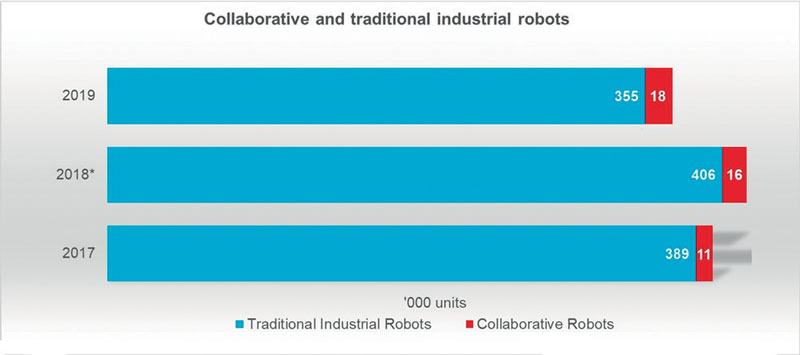
This is indeed the case! In 2019, 18,049 collaborative robots or cobots were installed, representing 4.8% of the 373,240 industrial robots sold during the year. IFR began collecting data and processing statistics on collaborative robots in 2017 when they had a market share of just 2.8%. As more and more new and historic robot suppliers offer collaborative robots and the range of applications continues to grow, the market share for this type of robot continues to grow. As a result, in contrast with the general trend, cobot installations have grown by 11% compared to 2018. The number seems small compared to what is generally imagined, but it should be noted that media activity on collaborative robots in recent years is enormous and tends to mask the fact that the number of units installed is still very low (Figure 7). Besides, this market, although it is growing rapidly, is still in its early stages.
Looking at our own country, could we say that Italy is also going against the trend?
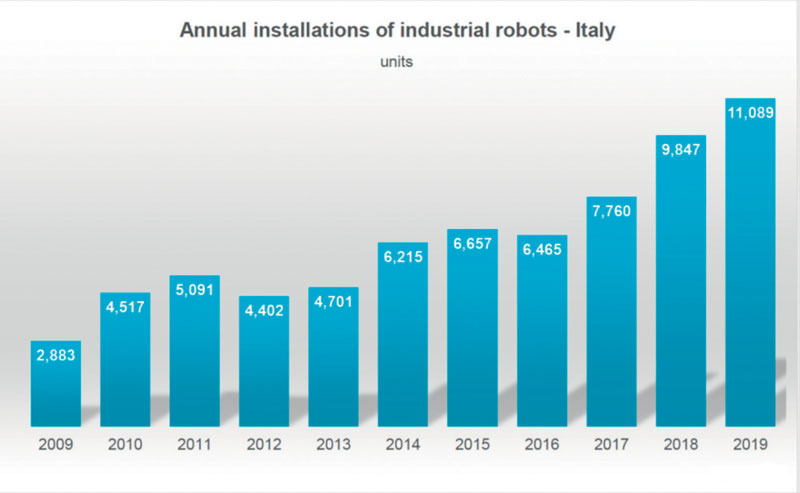
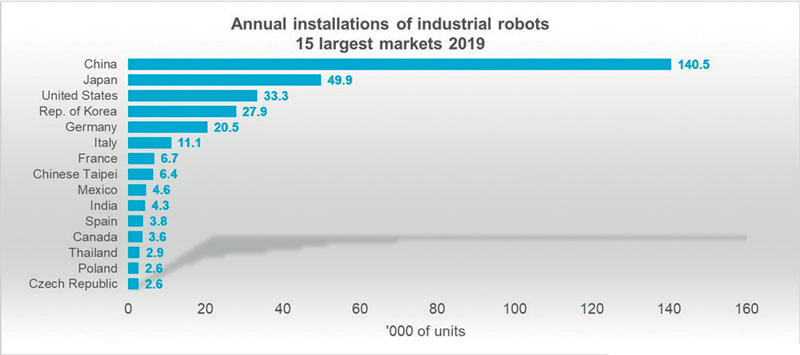
Italy has always been the second largest robot market in Europe after Germany. In 2018 it occupied sixth place in the world for population and seventh for sales. In 2019, with a sales value recorded by IFR of 11,089 new industrial robots installed, it grew by 13% compared to the 2018 results, rising from seventh to sixth place worldwide also in terms of sales and reaching a record value for the third consecutive year (Figures 8 and 9). Furthermore, we must not forget that in 2018 it had already recorded growth of 27% compared to the previous year and had climbed from eighth to seventh place in the world rankings. This is really a very important result, in full contrast with the entire industrialised world.
Indeed, +13% growth in Italy compares with data which are all negative: -12% worldwide, -13% in Asia and America, -10% in Japan, -9% in China, -5% in Europe and even -23% in Germany and -26% in Korea! For Italians who too often like to denigrate their country without supporting evidence, suffering from incorrigible xenophobia, it is also quite interesting to compare the average growth of Italy (+12%) and Germany (+0%) in 2014-2019, an undisputed indicator which shows how Italy is behaving absolutely better in this sector than the acclaimed Germany throughout the last decade.
To be precise, it should be noted that, in general, the results of the SIRI – UCIMU statistics, transmitted to IFR at the beginning of the year following the census in our country, are not always the same as the official results of IFR then published in Word Robotics and in particular this year they are lower. Each year the IFR statistics centre receives data from the robotics associations in each country and from all manufacturers in the world, then cross-references the data from the various sources and processes them with a general criterion for all countries. For their uniformity and greater completeness, the IFR data are therefore universally considered to be the official data to which everyone refers and when available, even if they are different, they prevail over those of the national associations which may miss operations between countries, due to excess or defect of their data.
Distribution by sector in Italy is also in contrast to the world trend, where in 2019 the automotive industry accounted for only 11% of sales (28% in the world) preceded by metalworking, which accounted for 26% (11% in the world).

The reasons for this growth are different. Italy has suffered a long recession after the economic crisis of 2008/2009, but the demand for digital and flexible technology from Industry 4.0 has grown strongly, also thanks to the support that the state has granted and that is still in force. In Italy, the automotive, metalworking, food and other industries have invested heavily in robotics and automation to become more competitive and efficient and to customise their production more easily. For this reason, in Italy, employment in general industry increased in 2019 from less than 320,000 to more than 330,000 jobs. Thanks to a strong metalworking industry, second only to Germany in Europe, and a strong food industry, Italy has shown that it can compensate with growth in these sectors for the decrease in demand from the Italian automotive industry, which absorbed only 1,268 industrial robots in 2019 when it was 1,902 in 2014, showing an average annual decrease of 8% in 2014-2019. The above is further confirmation of the importance of metalworking in our country, something not so well known to laymen. Added to this is the aforementioned food sector, which accounts for 10% of robot sales, a value now very close to that absorbed by the automotive industry.
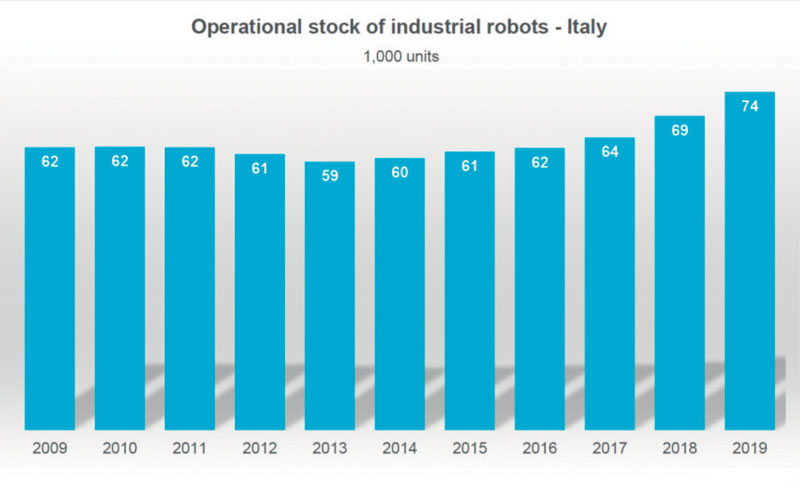
Thanks to these sales values, the population of industrial robots in Italy has risen to 674,400 units in 2019 with a growth of 8%, showing an average annual increase since 2014 of 4% (Figure 10).
Ups and downs have therefore characterised 2019 for robotics in the world; but then came 2020, transforming what was to be a bright future into a future full of uncertainties for robots too?
Apart from Italy, which, as far as robotics is concerned, had a 2019 in countertrend with good growth, 2019 was a year in which the markets all over the world showed a generalised downturn. The automotive industry, in particular, which is important not only for robotics as it is still a driving force for the industry in almost all advanced countries, is experiencing a transition towards electric motorization which is rather complex and full of uncertainties certainly not conducive to investment. This scenario, which already anticipated a recession at the beginning of 2020, was marked by the COVID-19 pandemic from China. Today, after more than eight months of the pandemic, damages can be counted: more than one million deaths and a major global recession (Figure 11). In August, the World Economic Forum estimated the economic loss at between $8 and $15 trillion, which by the end of the year will become $17.3 trillion, according to the Australian National University. This figure will increase at least until the vaccine is available and a more normal situation will be restored.
The increase in public deficits in advanced countries is around 20% of their GDP, with an equally significant increase in government debt. Meanwhile, unemployment in the 37 OECD countries has risen from 5.3% in 2019 to 9.7%. In the second quarter, global trade fell by 18.5%.
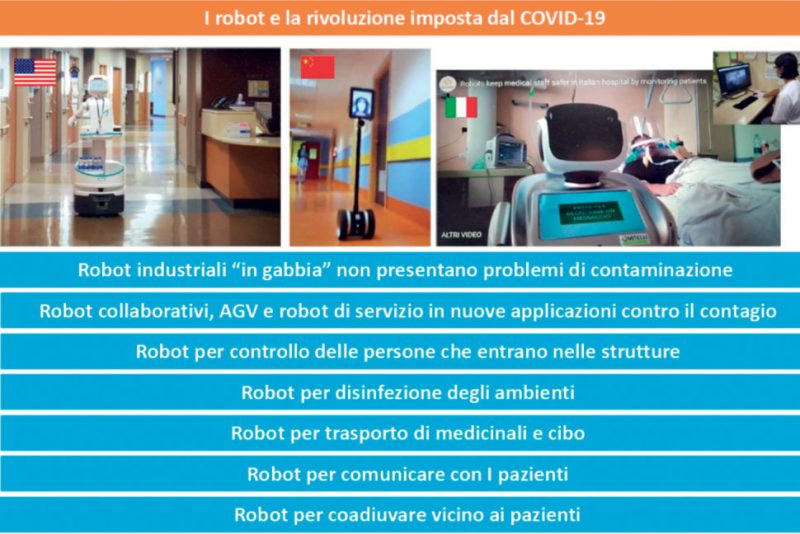
Robots have always been very useful to humans for their health at work. Since its creation in 1961, the industrial robot has been designed not only to improve the convenience and quality of production but also to relieve humans from heavy and harmful work. The whole history of industrial robotics has been and is at the service of humans, and the robot has gradually replaced them in the most dangerous or heavy tasks in order to leave them with the “ superior” ones offering greater satisfaction and salary while creating better jobs in greater numbers. Examining safety in the factory we see that traditional industrial robots, rigid and fast, work segregated with mechanical protections isolated from their operators, while recent collaborative robots, soft and slow, operate close to humans as they are designed and built to stop at the slightest contact with the operator. Having robots with these characteristics means allowing operators to use them in complete safety in their work area, so it becomes possible to achieve compliance with the main rule in pandemic situations, the distance between people, with a single operator. It is therefore possible to create safe work islands, each with a single operator assisted where necessary by one or more collaborative robots and each spaced correctly from the others to make the entire process free from the risk of infection. The connection of the production processes between each other and with the various warehouses can be carried out with the latest generation AGVs, which have now become true service robots for transporting the components, thus making the entire area of the factory a safe zone immune to the problem of contagion transmission. If we then leave the factories and move on to the healthcare sector, we see service robots which reduce the risks of contagion by performing intermediate operations which distance the healthcare workers or replace them. In these terrible months, we have seen them in television information programmes, operating in various hospitals, including Italian ones, helping medical staff to control people entering the facilities, to monitor them at the entrance, to disinfect the environments, to transport medicines and food, to help them with patients and in analysis laboratories (Figure 12).

It is therefore clear that the need to make factories, businesses and hospitals safer and more resilient to any pandemic will see robotics play a leading role in all aspects. Traditional robotics has always been a key player, and collaborative and service robotics with further developments and innovations will increasingly play a key role.
However, these considerations in favour of robotics and automation in such a critical situation are not enough to make reliable predictions at a time when everything is so tremendously uncertain. Today it is really difficult to assess the real economic costs of the pandemic, even more difficult to predict the overall result at the end of the year and its impact on the demand for robots in quantitative terms. For these reasons, this year IFR decided not to express in World Robotics 2020 the usual market forecast which should have presented data on the evolution of installed robots up to 2023, restricting itself to qualitative considerations on the potential effects of COVID-19 on the robotics industry, as summarised in Table 1.
On the other hand, SIRI has continued its monitoring work and has not stopped collecting and processing industry data in Italy. The results of the last meeting of its Statistics Working Group at the end of September showed the “sentiment” for the year 2020 of a significant and tested sample of the main operators in the sector in Italy. Based on the sales data for the first half of 2020 and the forecasts collected during the meeting, the forecast for 2020 is a drop in installed robots of 18%, thus reaching a sales value between the 2017 and 2018 figures (Figure 13). A substantial decrease which we hope has been overestimated but which represents the most reasonable forecast of our operators. Of course, with the next meeting of the group which will be held by February 2021, we shall be able to have an evaluation of the real value of the sales for the current year based on the sales data of the sample over the whole year, not just on the first half.

